How to Monitor a LangGraph Agent: Logs, Token Cost, Traces and Alerts
A runnable LangGraph monitoring setup on langgraph 1.2.15: JSON logs for every node, token usage and cost per run, OpenTelemetry traces with no account, and alerts for runaway loops.

Table of Contents
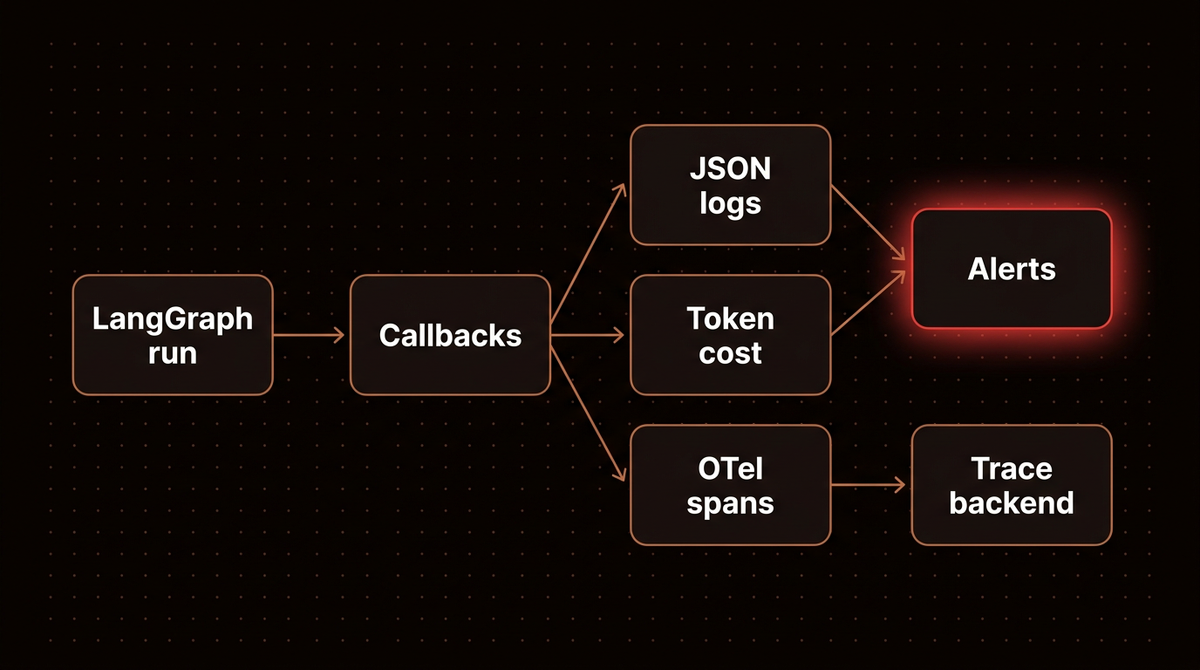
LangGraph monitoring comes down to four signals: what each node did, how many tokens each run burned, where a run went wrong, and whether a run is looping. That last one matters more than it looks, because on langgraph 1.2.15 a looping agent runs 10,007 steps before LangGraph stops it. This guide wires all four signals into a small agent with no API key and no paid calls, and every output below is pasted from my terminal. It is for Python developers who have a graph working on their laptop and now need to see it in production.
If you are still building the agent itself, start with my LangGraph tutorial for production AI agents. This page covers what that one skips: watching the graph once it runs.
Before you start
- Python 3.11 or newer. I used Python 3.13.12 in a fresh virtual environment.
- langgraph 1.2.15, langchain-core 1.6.10 and langsmith 0.14.8, the current releases on PyPI on 15 October 2026. The OpenTelemetry step adds the
otelextra of langsmith. - No model API key. The test model below replays scripted replies that carry realistic usage numbers, so every cost figure is computed, never billed.
- Two files in one folder:
agent.py(Step 2) andmonitor.py(Steps 4 to 6). Each code block below says which file it belongs to. - Optional: a LangSmith or Langfuse account for Step 7. The free tiers of both are enough to follow along.
- Comfort with a basic agentic loop: a model node, a tool node and a router between them.
Step 1: Install a pinned LangGraph monitoring stack
Pin the versions. Monitoring code reads metadata keys and environment variables that move between releases, and this guide found three places where the installed release and the docs disagree.
python3.13 -m venv venv
source venv/bin/activate
pip install "langgraph==1.2.15" "langchain-core==1.6.10" "langsmith[otel]==0.14.8"
Check it worked with pip list | grep lang. You should see langgraph-prebuilt 1.1.0 and langgraph-checkpoint 4.3.0 pulled in alongside the three packages above.
Step 2: Build a test agent whose model reports token usage
You cannot test cost tracking with a model that reports no usage, and you should not test it with one that bills you. My first attempt used LangChain's GenericFakeChatModel. It works with invoke, but the moment I streamed with stream_mode="messages" it crashed on the tool call turn with ValueError: No generations found in stream. So I wrote a 30 line scripted model that streams text word by word and puts the usage on its last chunk, the way real provider integrations behave. Save this as agent.py:
# agent.py
import itertools
import json
from typing import Any, Iterator

from langchain_core.language_models import BaseChatModel
from langchain_core.messages import AIMessage, AIMessageChunk
from langchain_core.outputs import ChatGeneration, ChatGenerationChunk, ChatResult
from langchain_core.tools import tool
from langgraph.graph import StateGraph, START, MessagesState
from langgraph.managed import RemainingSteps
from langgraph.prebuilt import ToolNode, tools_condition

MODEL = "claude-sonnet-5-5"

TOOL_CALL = AIMessage(
    content="",
    tool_calls=[{"name": "get_order_status", "args": {"order_id": "A-1042"}, "id": "call_1"}],
    usage_metadata={"input_tokens": 812, "output_tokens": 46, "total_tokens": 858,
                    "input_token_details": {"cache_read": 512}},
    response_metadata={"model_name": MODEL},
)
ANSWER = AIMessage(
    content="Order A-1042 shipped on 13 October and should arrive on 16 October.",
    usage_metadata={"input_tokens": 905, "output_tokens": 61, "total_tokens": 966,
                    "input_token_details": {"cache_read": 768}},
    response_metadata={"model_name": MODEL},
)


class ScriptedChatModel(BaseChatModel):
    replies: Iterator[AIMessage]

    @property
    def _llm_type(self) -> str:
        return "scripted"

    def _next(self) -> AIMessage:
        # A fresh copy each call, so every reply gets its own message id.
        return next(self.replies).model_copy(deep=True)

    def _generate(self, messages, stop=None, run_manager=None, **kwargs: Any) -> ChatResult:
        return ChatResult(generations=[ChatGeneration(message=self._next())])

    def _stream(self, messages, stop=None, run_manager=None, **kwargs: Any):
        msg = self._next()
        for word in msg.content.split(" ") if msg.content else []:
            chunk = ChatGenerationChunk(message=AIMessageChunk(content=word + " "))
            if run_manager:
                run_manager.on_llm_new_token(word + " ", chunk=chunk)
            yield chunk
        yield ChatGenerationChunk(message=AIMessageChunk(
            content="",
            tool_call_chunks=[{"name": c["name"], "args": json.dumps(c["args"]),
                               "id": c["id"], "index": i}
                              for i, c in enumerate(msg.tool_calls)],
            usage_metadata=msg.usage_metadata,
            response_metadata=msg.response_metadata,
        ))


def happy_path_model():
    return ScriptedChatModel(replies=iter([TOOL_CALL, ANSWER]))


def looping_model():
    """Never stops calling the tool: the classic runaway agent."""
    return ScriptedChatModel(replies=itertools.cycle([TOOL_CALL]))


@tool
def get_order_status(order_id: str) -> str:
    """Look up the shipping status of an order."""
    return f"{order_id}: shipped 2026-10-13, ETA 2026-10-16"


class State(MessagesState):
    remaining_steps: RemainingSteps


def build_graph(model=None, checkpointer=None, guard=True):
    model = model or happy_path_model()

    def agent(state: State):
        if guard and state["remaining_steps"] < 3:
            return {"messages": [AIMessage(content="I ran out of steps. Escalating to a human.")]}
        return {"messages": [model.invoke(state["messages"])]}

    builder = StateGraph(State)
    builder.add_node("agent", agent)
    builder.add_node("tools", ToolNode([get_order_status]))
    builder.add_edge(START, "agent")
    builder.add_conditional_edges("agent", tools_condition)
    builder.add_edge("tools", "agent")
    return builder.compile(checkpointer=checkpointer)
The model_copy line is there because of a bug I hit. When the model returned the same AIMessage object twice, both replies carried the same id, and LangGraph's message reducer replaced the old message instead of appending a new one. The loop quietly ended a turn early. Real models never repeat an id, but test doubles do. The usage numbers in TOOL_CALL and ANSWER are made up but shaped like a real Claude response, including cache reads. The RemainingSteps field and the guard flag come back in Step 6.
Step 3: Watch a run with stream modes and debug mode
Before you add any tooling, LangGraph already tells you a lot through graph.stream. The streaming docs list seven stream modes. Pass version="v2" and every chunk comes back as a dict with type, ns and data, which is far easier to route than the older tuples.
| Mode | What you get | Use it for | Checkpointer on 1.2.15 |
|---|---|---|---|
| updates | What each node changed, per step | Production event logs | Not needed |
| values | The full state after each step | Debugging state bugs locally | Not needed |
| messages | LLM tokens plus metadata such as langgraph_node | Chat UIs, per node token streams | Not needed |
| custom | Whatever you emit with get_stream_writer | Progress events from inside tools | Not needed |
| tasks | Task start and finish, with results and errors | Spotting which node failed | Docs say yes; it ran without one |
| debug | Checkpoints plus tasks with extra metadata | Deep local debugging only | Only for the checkpoint events |
The last column is what I measured, not what the docs say. Without a checkpointer, tasks streamed all six task events of a run, debug streamed the same six, and the seventh mode, checkpoints, streamed nothing. This loop prints the updates stream:
# step_stream.py
from langchain_core.messages import HumanMessage
from agent import build_graph

inputs = {"messages": [HumanMessage("Where is order A-1042?")]}
for part in build_graph().stream(inputs, stream_mode="updates", version="v2"):
    for node, update in part["data"].items():
        msg = update["messages"][-1]
        print(f"step from {node}: {type(msg).__name__} {msg.content[:50]!r} "
              f"usage={getattr(msg, 'usage_metadata', None)}")
step from agent: AIMessage '' usage={'input_tokens': 812, 'output_tokens': 46, 'total_tokens': 858, 'input_token_details': {'cache_read': 512}}
step from tools: ToolMessage 'A-1042: shipped 2026-10-13, ETA 2026-10-16' usage=None
step from agent: AIMessage 'Order A-1042 shipped on 13 October and should arri' usage={'input_tokens': 905, 'output_tokens': 61, 'total_tokens': 966, 'input_token_details': {'cache_read': 768}}Switch to stream_mode="messages", where each part["data"] is a (chunk, metadata) pair, and you see something people get wrong when they track usage. The text chunks carry no usage at all. It arrives on one chunk near the end of each model call, and an empty chunk follows it:
AIMessageChunk 'Order ' usage= None node= agent step= 3
AIMessageChunk 'A-1042 ' usage= None node= agent step= 3
...
AIMessageChunk 'October. ' usage= None node= agent step= 3
AIMessageChunk '' usage= {'input_tokens': 905, 'output_tokens': 61, 'total_tokens': 966, 'input_token_details': {'cache_read': 768}} node= agent step= 3
AIMessageChunk '' usage= None node= agent step= 3
So never count stream chunks as tokens. And debug mode, compiled with InMemorySaver() and a thread_id, gives you the shape of every task:
checkpoint step -1 name= None error= None keys= ['config', 'metadata', 'next', 'parent_config', 'tasks', 'values']
checkpoint step 0 name= None error= None keys= ['config', 'metadata', 'next', 'parent_config', 'tasks', 'values']
task step 1 name= agent error= None keys= ['id', 'input', 'name', 'triggers']
task_result step 1 name= agent error= None keys= ['error', 'id', 'interrupts', 'name', 'result']
Every task_result carries an error field. That is handy locally, but checkpoint events ship the full state, so I keep debug mode off in production and use updates instead. The docs now recommend the newer event streaming API for new apps. The stream mode API above still works on 1.2.15 and is what most existing code uses.
Step 4: Log every node as JSON with a callback handler
Streams only help the code that consumes them. For logs that reach your log platform no matter who calls the graph, attach a callback handler through the run config. LangGraph puts langgraph_node and langgraph_step into the metadata of every callback, so one small class covers every node. Start monitor.py with this:
# monitor.py
import json
import logging
import sys
import time
import uuid

from langchain_core.callbacks import BaseCallbackHandler, UsageMetadataCallbackHandler
from langchain_core.messages import HumanMessage
from langgraph.errors import GraphRecursionError

from agent import build_graph, looping_model

logging.basicConfig(stream=sys.stdout, level=logging.INFO, format="%(message)s")
log = logging.getLogger("agent")


def emit(level, event, **fields):
    log.log(level, json.dumps({"event": event, **fields}))


def alert(**fields):
    # Swap this for your pager, Slack webhook or email. Keep it out of the hot path.
    emit(logging.CRITICAL, "ALERT", **fields)


class NodeLogger(BaseCallbackHandler):
    def __init__(self, run_id):
        self.run_id = run_id
        self.started = {}

    def on_chain_start(self, serialized, inputs, *, run_id, metadata=None, **kwargs):
        node = (metadata or {}).get("langgraph_node")
        if node and kwargs.get("name") == node:  # skip runnables nested inside a node
            self.started[run_id] = (node, metadata.get("langgraph_step"), time.perf_counter())

    def on_chain_end(self, outputs, *, run_id, **kwargs):
        if run_id in self.started:
            node, step, t0 = self.started.pop(run_id)
            emit(logging.INFO, "node_end", run=self.run_id, node=node, step=step,
                 ms=round((time.perf_counter() - t0) * 1000, 2))

    def on_chain_error(self, error, *, run_id, **kwargs):
        if run_id in self.started:
            node, step, _ = self.started.pop(run_id)
            emit(logging.ERROR, "node_error", run=self.run_id, node=node, step=step,
                 error=type(error).__name__)
The name check matters. In my test run, five chain callbacks fired inside nodes but only three were nodes; the other two were the tools_condition router after each agent step. One JSON object per line means Datadog, CloudWatch, Loki or plain jq can parse it without a custom pattern. Here is a normal run:
{"event": "node_end", "run": "cfe4d16f", "node": "agent", "step": 1, "ms": 0.63}
{"event": "node_end", "run": "cfe4d16f", "node": "tools", "step": 2, "ms": 0.43}
{"event": "node_end", "run": "cfe4d16f", "node": "agent", "step": 3, "ms": 0.33}
I never log message content at INFO level. Prompts carry customer data, and logs get copied to more places than traces do.
Step 5: Track token usage and cost per run
LangChain ships a UsageMetadataCallbackHandler (documented in the models guide) that sums usage_metadata across every model call in a run, grouped by model name. Create a fresh one per run, or totals leak between users. Then price it yourself. I use the Anthropic pricing page for Claude Sonnet 5.5: $2 per million input tokens, $10 per million output tokens, and $0.10 per million for cache reads. Add this to monitor.py:
# monitor.py (continued)
PRICES = {"claude-sonnet-5-5": {"input": 2.00, "cache_read": 0.10, "output": 10.00}}


def run_cost(usage_by_model):
    total = 0.0
    for model, u in usage_by_model.items():
        p = PRICES[model]
        cached = u.get("input_token_details", {}).get("cache_read", 0)
        fresh = u["input_tokens"] - cached  # input_tokens already includes cache reads
        total += (fresh * p["input"] + cached * p["cache_read"]
                  + u["output_tokens"] * p["output"]) / 1_000_000
    return round(total, 6)
That subtraction is the easiest line to get wrong. In LangChain's usage format, input_tokens is the total and cache_read is a subset of it. Cache writes sit inside input_tokens too, as cache_creation, and Sonnet 5.5 bills them at $2.50 per million for the 5 minute cache and $4 for the 1 hour cache, so add that price if you turn caching on. Anthropic's raw API response is different: its input_tokens excludes both cache counts, so only subtract when you read LangChain's usage_metadata. Bill the whole input at the full rate and this example costs $0.004504 instead of $0.002072, about twice the real figure, and the gap widens as more of the prompt is cached. The run wrapper records usage in a finally block, so failed runs get costed too:
# monitor.py (continued)
def run_agent(graph, question, user_id, recursion_limit=None, budget_usd=0.05):
    run_id = str(uuid.uuid4())[:8]
    usage = UsageMetadataCallbackHandler()
    config = {
        "callbacks": [NodeLogger(run_id), usage],
        "run_name": "order-agent",
        "tags": ["prod", "order-agent"],
        "metadata": {"user_id": user_id, "run": run_id},
    }
    if recursion_limit:
        config["recursion_limit"] = recursion_limit
    t0 = time.perf_counter()
    try:
        result = graph.invoke({"messages": [HumanMessage(question)]}, config)
    except GraphRecursionError as e:
        alert(run=run_id, reason="recursion_limit", detail=str(e).splitlines()[0])
        return None
    except Exception as e:
        alert(run=run_id, reason="exception", error=type(e).__name__, detail=str(e)[:200])
        raise
    finally:
        cost = run_cost(usage.usage_metadata)
        emit(logging.INFO, "run_end", run=run_id, user=user_id,
             ms=round((time.perf_counter() - t0) * 1000, 1),
             usage=usage.usage_metadata, cost_usd=cost)
        if cost > budget_usd:
            alert(run=run_id, reason="over_budget", cost_usd=cost, budget_usd=budget_usd)
    return result


if __name__ == "__main__":
    out = run_agent(build_graph(), "Where is order A-1042?", user_id="u_17")
    print("answer:", out["messages"][-1].content)
Run python monitor.py. After the three node lines from Step 4, the run ends with this:
{"event": "run_end", "run": "cfe4d16f", "user": "u_17", "ms": 3.6, "usage": {"claude-sonnet-5-5": {"output_tokens": 107, "total_tokens": 1824, "input_tokens": 1717, "input_token_details": {"cache_read": 1280}}}, "cost_usd": 0.002072}
answer: Order A-1042 shipped on 13 October and should arrive on 16 October.
Check the math: 437 fresh input tokens at $2, 1,280 cached at $0.10 and 107 output at $10 per million comes to $0.002072. If the handler hands you an empty dict on a real model, the integration is not reporting usage while streaming. On ChatOpenAI the fix reported on the LangChain forum is stream_usage=True.
Step 6: Alert on recursion limits and errors
A runaway loop is the failure that costs real money, and the default limit on 1.2.15 is 10,007 steps. The Graph API docs say the default became 1,000 steps in version 1.0.6, and older guides still quote 25. I ran the looping model with the guard off and no limit set, through a fresh UsageMetadataCallbackHandler:
langgraph 1.2.15 | langchain-core 1.6.10
Recursion limit of 10007 reached without hitting a stop condition. You can increase the limit by setting the `recursion_limit` config key.
took 63.3s
model calls billed: 5004 | tokens: 4293432 | cost_usd: 5.560445
The 10,007 comes from langgraph's config module, where the LANGGRAPH_DEFAULT_RECURSION_LIMIT environment variable can override it. One stuck request made 5,004 model calls and $5.56 of Sonnet 5.5 spend, and that is a floor: my scripted context never grows, while a real conversation gets longer with every loop. Set recursion_limit in every production config, sized to your longest legitimate path plus a margin.
Then give the graph a chance to stop on its own. RemainingSteps is a managed value LangGraph fills in for each step, and the agent node from Step 2 checks it before calling the model.

To see both cases, add two runs to the __main__ block of monitor.py. The first has a tight cost budget so the budget alert fires too:
# monitor.py, inside if __name__ == "__main__":
run_agent(build_graph(model=looping_model(), guard=False), "Where is order A-1042?",
          user_id="u_17", recursion_limit=6, budget_usd=0.003)

out = run_agent(build_graph(model=looping_model()), "Where is order A-1042?",
                user_id="u_17", recursion_limit=6)
print("answer:", out["messages"][-1].content)
Without the guard, the run hits the limit, the wrapper raises two alerts, and the usage still lands in the log:
{"event": "node_end", "run": "ae1292a8", "node": "tools", "step": 6, "ms": 0.25}
{"event": "ALERT", "run": "ae1292a8", "reason": "recursion_limit", "detail": "Recursion limit of 6 reached without hitting a stop condition. You can increase the limit by setting the `recursion_limit` config key."}
{"event": "run_end", "run": "ae1292a8", "user": "u_17", "ms": 2.6, "usage": {"claude-sonnet-5-5": {"output_tokens": 138, "total_tokens": 2574, "input_tokens": 2436, "input_token_details": {"cache_read": 1536}}}, "cost_usd": 0.003334}
{"event": "ALERT", "run": "ae1292a8", "reason": "over_budget", "cost_usd": 0.003334, "budget_usd": 0.003}
With the guard, the agent escalates at step 5 and the user gets a real reply instead of a stack trace:
{"event": "node_end", "run": "5a6318a0", "node": "agent", "step": 5, "ms": 0.06}
{"event": "run_end", "run": "5a6318a0", "user": "u_17", "ms": 1.8, "usage": {"claude-sonnet-5-5": {"output_tokens": 92, "total_tokens": 1716, "input_tokens": 1624, "input_token_details": {"cache_read": 1024}}}, "cost_usd": 0.002222}
answer: I ran out of steps. Escalating to a human.
The alert function only writes a CRITICAL log line. In production, point your log platform's alert rule at "event": "ALERT", or post to a webhook from a background queue so a slow pager never slows a user's request. If you pause runs for review rather than escalate, my guide to human approval in LangGraph shows how to resume them after a restart.
Step 7: Send traces to LangSmith, Langfuse or OpenTelemetry
Logs tell you that something happened. Traces show the whole tree of a run: every node, model call and tool call with inputs, outputs, latency and tokens. That is the core of agent observability, and you have three practical routes.
LangSmith. Set these environment variables and every LangGraph run is traced, with no code change:
export LANGSMITH_TRACING=true
export LANGSMITH_API_KEY=<your key>
export LANGSMITH_PROJECT=order-agent-prod
The run_name, tags and metadata from Step 5 show up on each trace, so you can filter by user. LangSmith also has built in alerts on run count, cost, errors, feedback score and latency, routed to Slack, PagerDuty or a webhook. If you run graphs locally, my LangGraph Studio setup guide covers the visual debugger that reads the same traces.
Langfuse. It is open source, and the LangGraph integration is one more callback in the same list as mine. Install langfuse, set LANGFUSE_PUBLIC_KEY, LANGFUSE_SECRET_KEY and LANGFUSE_BASE_URL, and add the handler where run_agent builds its config. I confirmed the import and constructor on langfuse 5.0.1:
# monitor.py, inside run_agent
from langfuse.langchain import CallbackHandler

config = {
    "callbacks": [NodeLogger(run_id), usage, CallbackHandler()],
    # run_name, tags and metadata as before
}
Any OpenTelemetry backend. This is the route I tested end to end, because it needs no account. LangSmith's SDK can emit OpenTelemetry spans instead of sending anything to LangSmith. The OpenTelemetry guide uses LANGSMITH_OTEL_ENABLED plus LANGSMITH_OTEL_ONLY. On langsmith 0.14.8 those still work, and the source also reads a newer LANGSMITH_TRACING_MODE variable that takes precedence when both are set. Set the variables and the tracer provider before you import anything from LangChain:
# otel_console.py
import os
os.environ["LANGSMITH_TRACING"] = "true"
os.environ["LANGSMITH_TRACING_MODE"] = "otel"  # nothing goes to LangSmith

from opentelemetry import trace
from opentelemetry.sdk.trace import TracerProvider
from opentelemetry.sdk.trace.export import SimpleSpanProcessor
from opentelemetry.sdk.trace.export.in_memory_span_exporter import InMemorySpanExporter

exporter = InMemorySpanExporter()  # use OTLPSpanExporter(endpoint=...) in production
provider = TracerProvider()
provider.add_span_processor(SimpleSpanProcessor(exporter))
trace.set_tracer_provider(provider)

from langchain_core.messages import HumanMessage
from langchain_core.tracers.langchain import wait_for_all_tracers
from agent import build_graph

build_graph().invoke({"messages": [HumanMessage("Where is order A-1042?")]},
                     {"run_name": "order-agent", "metadata": {"user_id": "u_17"}})
wait_for_all_tracers()  # spans are handed over on a background thread
provider.force_flush()

for span in sorted(exporter.get_finished_spans(), key=lambda s: s.start_time):
    keep = {k: v for k, v in span.attributes.items()
            if k.startswith("gen_ai.usage") or k in ("langsmith.span.kind", "langsmith.metadata.user_id")}
    print(f"{span.name:<18} parent={'-' if not span.parent else 'yes'}  {keep}")
With no LangSmith key in the environment, that printed nine spans:
order-agent        parent=-  {'langsmith.span.kind': 'chain', 'langsmith.metadata.user_id': 'u_17'}
agent              parent=yes  {'langsmith.span.kind': 'chain', 'langsmith.metadata.user_id': 'u_17'}
ScriptedChatModel  parent=yes  {'langsmith.span.kind': 'llm', 'langsmith.metadata.user_id': 'u_17', 'gen_ai.usage.input_tokens': 812, 'gen_ai.usage.output_tokens': 46, 'gen_ai.usage.total_tokens': 858}
tools_condition    parent=yes  {'langsmith.span.kind': 'chain', 'langsmith.metadata.user_id': 'u_17'}
tools              parent=yes  {'langsmith.span.kind': 'chain', 'langsmith.metadata.user_id': 'u_17'}
get_order_status   parent=yes  {'langsmith.span.kind': 'tool', 'langsmith.metadata.user_id': 'u_17'}
agent              parent=yes  {'langsmith.span.kind': 'chain', 'langsmith.metadata.user_id': 'u_17'}
ScriptedChatModel  parent=yes  {'langsmith.span.kind': 'llm', 'langsmith.metadata.user_id': 'u_17', 'gen_ai.usage.input_tokens': 905, 'gen_ai.usage.output_tokens': 61, 'gen_ai.usage.total_tokens': 966}
tools_condition    parent=yes  {'langsmith.span.kind': 'chain', 'langsmith.metadata.user_id': 'u_17'}
Two details from that run. My first version printed nothing at all, because a short script exits before the background thread hands the spans over; wait_for_all_tracers() fixed it. And the spans carry input, output and total tokens but not the cache read count, so keep the Step 5 cost line if your cost depends on caching.
Here is how the hosted options compared on their pricing pages on 15 October 2026:
| Option | Free tier | Paid entry | Overage | Retention |
|---|---|---|---|---|
| LangSmith Developer | 5k base traces a month, 1 seat | $0 | Pay as you go | 14 days base |
| LangSmith Plus | 10k base traces a month | $39 per seat a month | 0.005 LSU ($0.005) per base trace | 14 days base, 180 days extended |
| Langfuse Cloud Hobby | 50k units a month, 2 users | $0 | None, upgrade required | 30 days |
| Langfuse Cloud Core | 100k units a month | $29 a month | $8 per 100k units | 90 days |
| Langfuse self hosted | Unlimited | $0, MIT license | Your infrastructure | You decide |
Sources: the LangSmith pricing page, where the per trace rate sits in the tooltip beside "Pay as you go" and 1 LSU equals $1, and the Langfuse pricing page. Older posts quote a lower LangSmith rate per thousand traces, so check that tooltip before you budget. Langfuse counts units as traces plus observations plus scores, so one trace of a busy agent is many units.
Troubleshooting
ValueError: No generations found in streamin tests.GenericFakeChatModelcannot stream a tool call message. Useinvokein that test, or a scripted model like the one in Step 2.- A test loop ends one turn early. Your test double is returning the same message object, so the reducer replaces it by id. Return a copy.
UsageMetadataCallbackHandlerreturns{}. The model integration is not reporting usage while streaming. Call the model directly with the handler to confirm, then turn on the provider's stream usage option.- Usage keyed by an odd model name. The handler groups by
response_metadata["model_name"]. Map every name your providers return in the price table, orrun_costraises aKeyError. That is a loud failure on purpose. - The
checkpointsstream mode prints nothing. It needs a checkpointer. Compile with one and pass athread_id. My Postgres checkpointer guide covers the production setup. - No spans reach your OpenTelemetry collector. Install
langsmith[otel], setLANGSMITH_TRACING=true, and flush before the process exits. If you set the endpoint through theOTEL_EXPORTER_OTLP_ENDPOINTenvironment variable, give it the base URL: per the LangSmith guide, appending/v1/tracesyourself produces a 404. Theendpointargument ofOTLPSpanExporterworks the other way and needs the full URL ending in/v1/traces.
Going further
Price the tracing before you pick it. At 100,000 runs a month, LangSmith Plus with one seat comes to $39 plus 90,000 extra base traces at $0.005, so $489. My test run produced nine spans. If each becomes one Langfuse observation plus one trace, that is ten units a run and a million units a month: $29 plus 900,000 extra units at $8 per 100,000, so $101 on Core. Self hosting Langfuse costs whatever its servers cost you. Those are estimates from list prices and my span count, so run your own graph for a day and multiply.
When I set this up on an agent, I keep three layers: JSON logs and the cost line from Steps 4 and 5 always on, because they are free and live with the rest of the app's logs; a tracing backend, sampled down if volume makes it expensive; and alerts on the cost and recursion events, not on raw error counts, because a tool timing out once is noise while a loop is money. If you deploy with the LangGraph server, my LangGraph CLI guide shows how to run it in Docker, and the same environment variables apply there.
When not to bother: a graph with no cycles and one model call does not need a recursion guard, and a prototype nobody else uses does not need a tracing bill. Add the log line and the cost line anyway.
If you would rather have an agent built with this monitoring in place from day one, that is what I do: see how I build AI agents.
Frequently asked questions
What is the best way to monitor a LangGraph agent in production?
Use three layers. Log every node as structured JSON through a callback handler, record token usage and cost per run with UsageMetadataCallbackHandler, and send traces to LangSmith, Langfuse or an OpenTelemetry backend. Then alert on recursion limit errors and on runs that exceed a cost budget, because those two catch the failures that cost money.
How do I track token usage in LangGraph?
Pass a fresh UsageMetadataCallbackHandler from langchain-core in the callbacks list of the run config. After the run, its usage_metadata attribute holds input, output and total tokens per model, including cache reads under input_token_details. Remember that input_tokens already includes the cached tokens when you compute cost.
What is the default recursion limit in LangGraph?
On langgraph 1.2.15 the default is 10,007 steps, which I confirmed by running a looping agent until it raised GraphRecursionError. The docs say 1,000 and older guides say 25. You can change the default with the LANGGRAPH_DEFAULT_RECURSION_LIMIT environment variable, but setting recursion_limit in each run config is clearer.
Can I use LangGraph without LangSmith?
Yes. LangGraph is open source and runs without any LangSmith account. You can log with Python's logging module, trace with Langfuse through its LangChain callback handler, or export OpenTelemetry spans to any collector by setting the LangSmith SDK to OpenTelemetry only mode, which sends nothing to LangSmith and needs no API key.
Does LangGraph debug mode work in production?
It works, but I would not run it there. With a checkpointer, the debug stream mode emits the full state with every checkpoint event, which is heavy and can carry customer data into your logs. Use the updates mode for production event streams and keep debug for local work.
Published
October 14, 2026
Category
AI Agents
Jahanzaib Ahmed
AI Systems Engineer & Founder
AI Systems Engineer with 126 production systems shipped. I run AgenticMode AI (AI agents, RAG systems, voice AI) and ECOM PANDA (ecommerce agency). I build AI that works in the real world for businesses across home services, healthcare, ecommerce, SaaS, and real estate.
Related articles
How to Run LangGraph Sessions for Many Users on One Checkpointer
Per user and per conversation sessions in LangGraph: thread ids with an owner check, memory across sessions in the store, listing and resuming, expiry and deletion, and the race when two messages hit one thread.
How toAI AgentsLangGraph
How to Use the LangGraph CLI to Build and Run an Agent Server in Docker
Every LangGraph CLI command run for real on version 0.4.33, from langgraph new to a Docker image, plus the two traps the docs skip: a build that copies your .env file and a Python 3.11 default base image.
How toAI AgentsLangGraph
How to Use MCP Servers in LangGraph (and Serve a Graph as One)
Connect a LangGraph agent to MCP servers with langchain.mcp, then serve your own graph over /mcp. Every example was run on LangGraph 1.2.14, with the old adapters package covered too.
How toAI AgentsLangGraph