How to Set Up LangGraph Studio and Debug an Agent on Your Own Machine
A tested walkthrough of LangGraph Studio in its current browser form: install the CLI, run langgraph dev, fix the Chrome and Safari connection errors, then inspect, fork and pause a live agent run.


Table of Contents
Most LangGraph Studio guides still start with downloading a desktop app. The current version runs in your browser against a small local server, and this guide gets it running against your own graph in about 20 minutes: every node your agent passed through, the state at each step, and a way to rewind, edit that state and run again. Studio itself is free, and you can do the whole first session without an LLM API key, because the example graph below makes no model calls. It's written for Python developers who already have a LangGraph project, or want one, and are tired of debugging agents with print statements.
I ran every command here on September 27, 2026, with langgraph-cli 0.4.32 (released four days earlier) and langgraph 1.2.12. Where my run disagreed with the docs, I say so.
One naming note before you search for anything. LangChain launched this tool in August 2024 as a desktop app for Apple Silicon. It's now called LangSmith Studio, and it runs in the browser at smith.langchain.com, talking to a small server on your machine. Several of the tutorials on the first page of Google still describe the old desktop app. You don't need it.
Before you start
- Python 3.11 or newer. The Studio setup docs require it for the local server. I used 3.13.
- A free LangSmith account at smith.langchain.com. The browser side of Studio lives there, so you sign in once.
- A LangSmith API key, only when you want traces or experiments. More on that in Step 3.
- Chrome, Edge, Safari or Brave. Each needs a different fix to reach localhost. The table in Step 5 covers all four.
- Cost: Studio is free. The LangSmith Developer plan is $0 for one seat with up to 5,000 base traces a month. Your model tokens are billed by your model provider, as always.
If you have never built a graph at all, read my LangGraph tutorial for production agents first. This guide assumes you know what a node and a state schema are. The LangGraph glossary entry has the short version.
Step 1: Install the LangGraph CLI in a fresh virtual environment
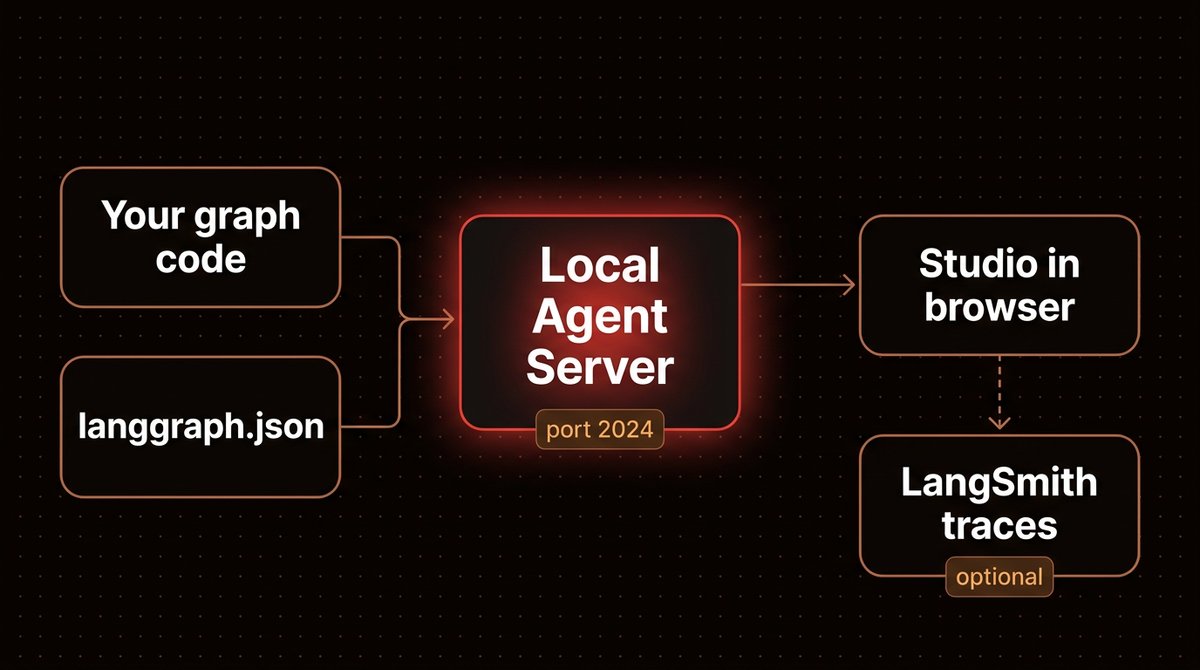
The CLI starts the local Agent Server that Studio connects to. The inmem extra is what lets it run without Docker or a database: state is kept in memory and flushed to a local folder.
mkdir triage-agent && cd triage-agent
python3 -m venv .venv
source .venv/bin/activate
pip install --upgrade "langgraph-cli[inmem]" langgraph
Check it worked with pip show langgraph-cli. You want 0.4.x. If you're on something older, note that the --allow-blocking flag you may need later was only added in 0.2.6, according to the CLI reference.
Step 2: Write a graph Studio can draw properly
I start every Studio session with a graph that calls no model. It separates two questions that otherwise get tangled: is Studio wired up, and is my agent behaving. This one routes a support ticket to billing or technical support with a keyword check. Run mkdir src in the project folder, then save it as src/triage.py:
from typing import Literal, TypedDict

from langgraph.graph import END, START, StateGraph


class TicketState(TypedDict, total=False):
    ticket: str
    queue: str
    reply: str


def classify(state: TicketState) -> dict:
    text = state["ticket"].lower()
    billing_words = ("invoice", "refund", "charge", "billing", "card")
    queue = "billing" if any(w in text for w in billing_words) else "technical"
    return {"queue": queue}


def route(state: TicketState) -> Literal["billing", "technical"]:
    return state["queue"]


def billing(state: TicketState) -> dict:
    return {"reply": "Billing team: I have pulled your last invoice and will confirm the charge today."}


def technical(state: TicketState) -> dict:
    return {"reply": "Support: please send the exact error message and the time it happened."}


builder = StateGraph(TicketState)
builder.add_node("classify", classify)
builder.add_node("billing", billing)
builder.add_node("technical", technical)
builder.add_edge(START, "classify")
builder.add_conditional_edges("classify", route)
builder.add_edge("billing", END)
builder.add_edge("technical", END)

graph = builder.compile()
Look at the return type on route. Studio reads that Literal["billing", "technical"] to decide where the conditional edge can go. Without it, the drawing is wrong.
Warning: The troubleshooting page says an undefined conditional edge makes Studio assume it can reach every node. That's not what I got. With the hint removed, the server reported a single edge from classify straight to the end, and the billing and technical nodes had no edges at all. Either way the picture is wrong. Use a Literal return type or pass a path map as the third argument to add_conditional_edges.
Step 3: Add langgraph.json and a .env file
The config file tells the CLI where your compiled graph lives. Put it in the project root:
{
  "dependencies": ["."],
  "graphs": {
    "triage": "./src/triage.py:graph"
  },
  "env": ".env"
}
The key under graphs (triage here) becomes the graph's name in Studio's dropdown. The value is path:variable and must point at the compiled graph object; the builder won't load. "dependencies": ["."] tells the server to install the current folder, so if your graph imports other packages, list them in a requirements.txt or pyproject.toml in the same folder.
Now the .env file, also in the project root. The docs ask for LANGSMITH_API_KEY here, and you'll want it eventually. For a first run I use this instead:
LANGSMITH_TRACING=falseWith tracing off, the docs say no data leaves your local server. My server started and answered every API call with no key set at all; the log just noted it was skipping a metadata loop. I add the key later, when I want runs recorded as LangSmith traces or need the Run experiment button, which the troubleshooting page says stays disabled without it. If your agent handles customer data, starting with tracing off is the sensible default anyway. The observability glossary entry explains what a trace would have captured.
Note: Add .env and .langgraph_api/ to your .gitignore now. The second one is where the dev server saves threads and checkpoints between restarts, as pickle files, and it fills up with real inputs the moment you test with real tickets.
Step 4: Start the server with langgraph dev
From the project root, with the virtual environment active:
langgraph devOn my machine it was ready in 2.6 seconds and printed three addresses:
- API: http://127.0.0.1:2024
- Studio UI: https://smith.langchain.com/studio/?baseUrl=http://127.0.0.1:2024
- API Docs: http://127.0.0.1:2024/docs
It also tries to open your browser. Pass --no-browser if you'd rather not, or --port 2025 if something already holds 2024. Leave this terminal running for the rest of the guide. The banner is explicit that this server is "designed for development and testing." Before touching Studio, prove the server is serving your graph from a second terminal:
curl -s -X POST http://127.0.0.1:2024/assistants/search \
  -H "Content-Type: application/json" \
  -d '{"graph_id": "triage"}'
You should get back one assistant named triage. If you get a 404 that says the graph wasn't found, the name in langgraph.json doesn't match the one you asked for.
Step 5: Open your graph in LangGraph Studio
Open the Studio UI link from the log. You should land in graph mode with classify fanning out to billing and technical. The other way in, per the Studio quickstart: open Deployments in LangSmith, click Studio, enter http://127.0.0.1:2024 and click Connect. If you see an error instead of a graph, suspect the browser first. Chrome from version 142 enforces Local Network Access (the LangChain troubleshooting page calls it by its older spec name, Private Network Access), which blocks an HTTPS site like smith.langchain.com from calling a plain HTTP server on localhost unless you allow it. Each browser needs its own fix:
| Browser | What you see | Fix |
|---|---|---|
| Chrome 142+ and Edge | "Failed to initialize Studio" with "TypeError: Failed to fetch", while /docs loads fine | Click the lock icon left of the address bar, set Local network access to Allow, reload |
| Safari | "Failed to load assistants" | Run langgraph dev --tunnel, then Connect to a local server, paste the tunnel URL, add it to Allowed Origins |
| Brave | "Failed to load assistants" | Turn Shields off for smith.langchain.com, or use the tunnel |
| Any Chromium browser with AI extensions | Connection fails after the fixes above | Disable extensions and retry; the docs single out the Ollama extension |
I'd avoid the tunnel unless you're on Safari. The CLI reference says it exposes your local server through a public Cloudflare tunnel, and the troubleshooting page warns those tunnels can disconnect intermittently. The Chrome permission is a single click. On Safari, Connect to a local server is on the Studio page at smith.langchain.com/studio.
Step 6: Submit a run and read the thread
In graph mode, the Input section under the graph renders a form from your state schema. Type I was charged twice on my last invoice into the ticket field and click Submit. Click View Raw if you'd rather paste JSON.
The run creates a thread, and the right pane shows its history. Here's what the server recorded for that input:
- Checkpoint before start. Input only, next node
__start__. - After start. Next node
classify. - After classify.
queueis nowbilling, next nodebilling. - Final.
replyholds the billing message, nothing left to run.
Four checkpoints for three nodes' worth of work. That checkpoint list is what you came for. When a real agent picks the wrong tool, you open the checkpoint right before the decision and read the exact state the model saw, instead of guessing from the final answer. The Studio usage docs describe a Pretty and JSON switch for when a state object gets large. The same threads are what give an agent memory within a conversation, which I cover in my agent memory architecture guide.
If your graph's state extends MessagesState, you can also flip to chat mode, a simpler conversation view that the Studio docs suggest for business users and anyone testing overall agent behavior. The triage state has no messages, so graph mode is the only option here.
Step 7: Rewind, edit state and fork the run
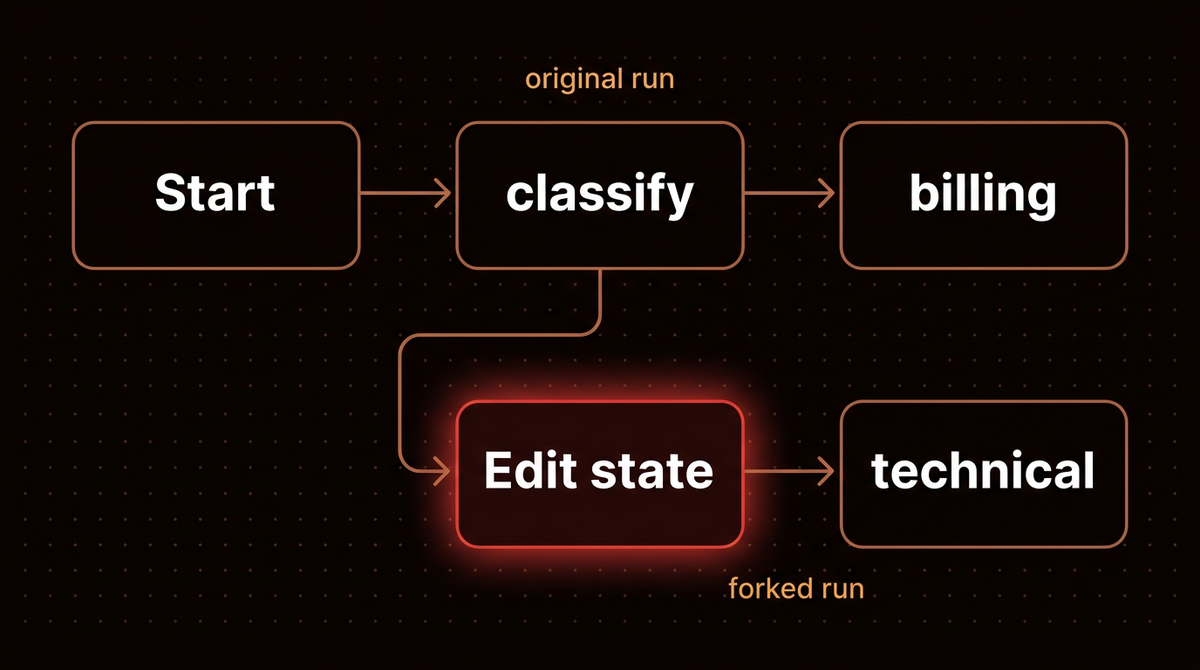
Forking is what I use most. Say the classifier got a ticket wrong. You don't need to rerun the whole agent or rewrite the input. You fix the state at the point it went wrong and let the rest of the graph run from there.
- Find the checkpoint. In the thread history, find the entry for the
classifynode, the step whose output setqueuetobilling. - Edit it. Click Edit node state (the pencil) and change
queuefrombillingtotechnical. - Fork. Click Fork. Studio creates a new run from that checkpoint with your edited value.
Those button labels come from the Studio usage docs. I made the same edit through the server's API, the one Studio calls, and the forked run went to the technical node and returned the support reply. The thread grew from four checkpoints to six, and the original billing branch stayed intact next to it. Nothing got overwritten.
Use Re-run from here instead when you changed code, not state. Save a prompt tweak in your editor, and the dev server's hot reload picks it up. Mine reloaded within about six seconds. Then rerun from the checkpoint before the node you touched.
Step 8: Pause before a node and step through it
Breakpoints stop the run before a node executes, so you can check state first. Click Interrupt, pick a node, and choose whether to pause before or after it runs. The run halts there, you inspect or edit the state, and Continue in the thread log resumes it. It's the same mechanism behind human in the loop approval steps, so it doubles as a way to rehearse them.
When state alone doesn't explain a bug and you need to step through Python line by line, attach a real debugger. The Studio quickstart covers it:
pip install debugpy
langgraph dev --debug-port 5678
Then attach your editor. In VS Code, add this to .vscode/launch.json and start it from the Run and Debug panel:
{
  "name": "Attach to LangGraph",
  "type": "debugpy",
  "request": "attach",
  "connect": { "host": "0.0.0.0", "port": 5678 }
}
In PyCharm, create a Python Debug Server configuration on port 5678. Breakpoints you set in classify will now hit when you submit from Studio. Add --wait-for-client to the langgraph dev command and, per the CLI reference, the server waits for your debugger to connect before it starts.
Troubleshooting
Past the browser errors in Step 5, these are the problems I either hit myself or found in the official docs:
| Symptom | Cause | Fix |
|---|---|---|
Run fails with BlockingError and "An internal error occurred" | A synchronous call such as time.sleep inside an async node | Read the terminal, not Studio: the full explanation only prints there. Use an async client or await asyncio.to_thread(...). --allow-blocking hides it in development only |
A new graph you added to langgraph.json doesn't appear | Hot reload watches your code, not the config | Stop and restart langgraph dev. Until I did, the API answered "Graph not found" and listed only the old one |
| Nodes float with no edges, or edges point everywhere | Conditional edge without declared targets | Add a Literal return type or a path map (Step 2) |
| Old threads still there after a restart | The dev server persists them in .langgraph_api/ | Expected. Delete that folder for a clean slate |
| Run experiment is greyed out | Old CLI, or no API key | Upgrade langgraph-cli and set LANGSMITH_API_KEY |
Studio shows only a generic message for BlockingError, so people assume Studio is broken. In my test the terminal printed three options, starting with an async driver (its example swaps requests.get() for an async client). Take that one. A blocking call that slips through here will stall every other run on a deployed server.
Adding a real model, and what it costs
Once the wiring works, swap the keyword check in classify for a model call, or point graphs at an agent from create_agent, which the setup docs note returns a compiled graph Studio can load directly. Nothing else in this setup changes. The same pattern carries over to retrieval graphs; my agentic RAG guide is a good graph to open in Studio next, because its retrieve and grade loop is exactly the kind of branch you want to watch.
Costs stay small for one developer. Studio has no fee. Traces only count against your LangSmith allowance when tracing is on, and the Developer plan includes 5,000 base traces a month, kept for 14 days. A team that needs more seats moves to Plus at $39 per seat a month with 10,000 base traces, per the pricing page. The real cost of heavy Studio use is model tokens: every fork of a node that calls a model is a paid call, so fork the cheap nodes freely and the expensive ones deliberately.
When not to use it: if your agent isn't a LangGraph graph, Studio has nothing to connect to. For CrewAI or Pydantic AI, lean on their own tooling, covered in my CrewAI Flows guide and Pydantic AI tutorial. Still picking a framework? This comparison of three self hosted stacks weighs that call. And langgraph dev is a development server, as its own startup banner says. Don't expose it to the internet as your production API.
If you'd rather have an agent like this built, instrumented and monitored for you, that's the work I do: see how I build AI agents.
Frequently asked questions
Is LangGraph Studio free?
Yes. LangChain describes Studio as a free visual interface for testing agents on your own machine. You need a LangSmith account, and the Developer plan costs nothing for one seat with 5,000 base traces a month. You pay separately for any model API calls your graph makes, and for extra traces only if you turn tracing on and exceed the allowance.
Is LangGraph Studio the same as LangSmith Studio?
Yes, it's the same product under a new name. LangChain launched LangGraph Studio in August 2024 as a desktop app for Apple Silicon, then moved it into the browser and renamed it LangSmith Studio. Today you run langgraph dev locally and open Studio at smith.langchain.com. Guides that tell you to download an app or install Docker describe the old version.
Do I need Docker to run LangGraph Studio?
No. The langgraph dev command, installed with the inmem extra of the LangGraph CLI, runs a lightweight server with no Docker installation, according to the CLI reference. It keeps state in memory and saves it to a local folder. Docker only comes in with langgraph up, which the CLI reference says runs the server locally in Docker. You don't need it for debugging.
Can I use LangGraph Studio without sending data to LangSmith?
Yes. Set LANGSMITH_TRACING=false in your project's .env file and, per the LangChain docs, no data leaves your local server. The Studio interface still loads from smith.langchain.com, but it reads your graph and threads straight from the server on your machine. You lose traces and dataset experiments until you turn tracing back on.
Why does Studio say "Failed to fetch" when my server is running?
Chrome 142 and later block HTTPS pages from calling HTTP servers on localhost unless you grant Local Network Access. If http://127.0.0.1:2024/docs loads but Studio won't connect, click the lock icon next to the address bar on smith.langchain.com, set Local network access to Allow and reload. Safari needs the --tunnel flag instead.
Does LangGraph Studio work with JavaScript graphs?
Yes. The Studio quickstart starts the same local server for JavaScript projects with npx @langchain/langgraph-cli dev, and the --tunnel option is there too for Safari users. The graph, thread history, forking and breakpoint features work the same way, because Studio only talks to the Agent Server API and doesn't care which language your graph is written in.
Published
September 27, 2026
Category
AI Agents
Jahanzaib Ahmed
AI Systems Engineer & Founder
AI Systems Engineer with 126 production systems shipped. I run AgenticMode AI (AI agents, RAG systems, voice AI) and ECOM PANDA (ecommerce agency). I build AI that works in the real world for businesses across home services, healthcare, ecommerce, SaaS, and real estate.
Related articles
How to Build Your Own AI Agent: 3 Self-Hosted Stacks Compared (2026)
After 126 production builds, here is my real comparison of three self-hosted AI agent stacks (Pydantic AI, LangGraph, n8n) plus a five-minute decision framework.
How toAI AgentsAI Agents
How to Build an AI Agent in 2026: Custom Code vs Frameworks vs No-Code (Real Decision Guide)
A decision guide for how to build an AI agent in 2026. After 126 production builds, here's how I pick between custom code, frameworks like LangGraph, and no-code platforms.
How toTrends & InsightsAI Agents
LangGraph Tutorial: How I Build Production AI Agents With It
A hands-on LangGraph tutorial covering state schemas, nodes, edges, checkpointing, human-in-the-loop patterns, streaming, and real production cost data from 23 deployed systems.
GuideImplementationLangGraph